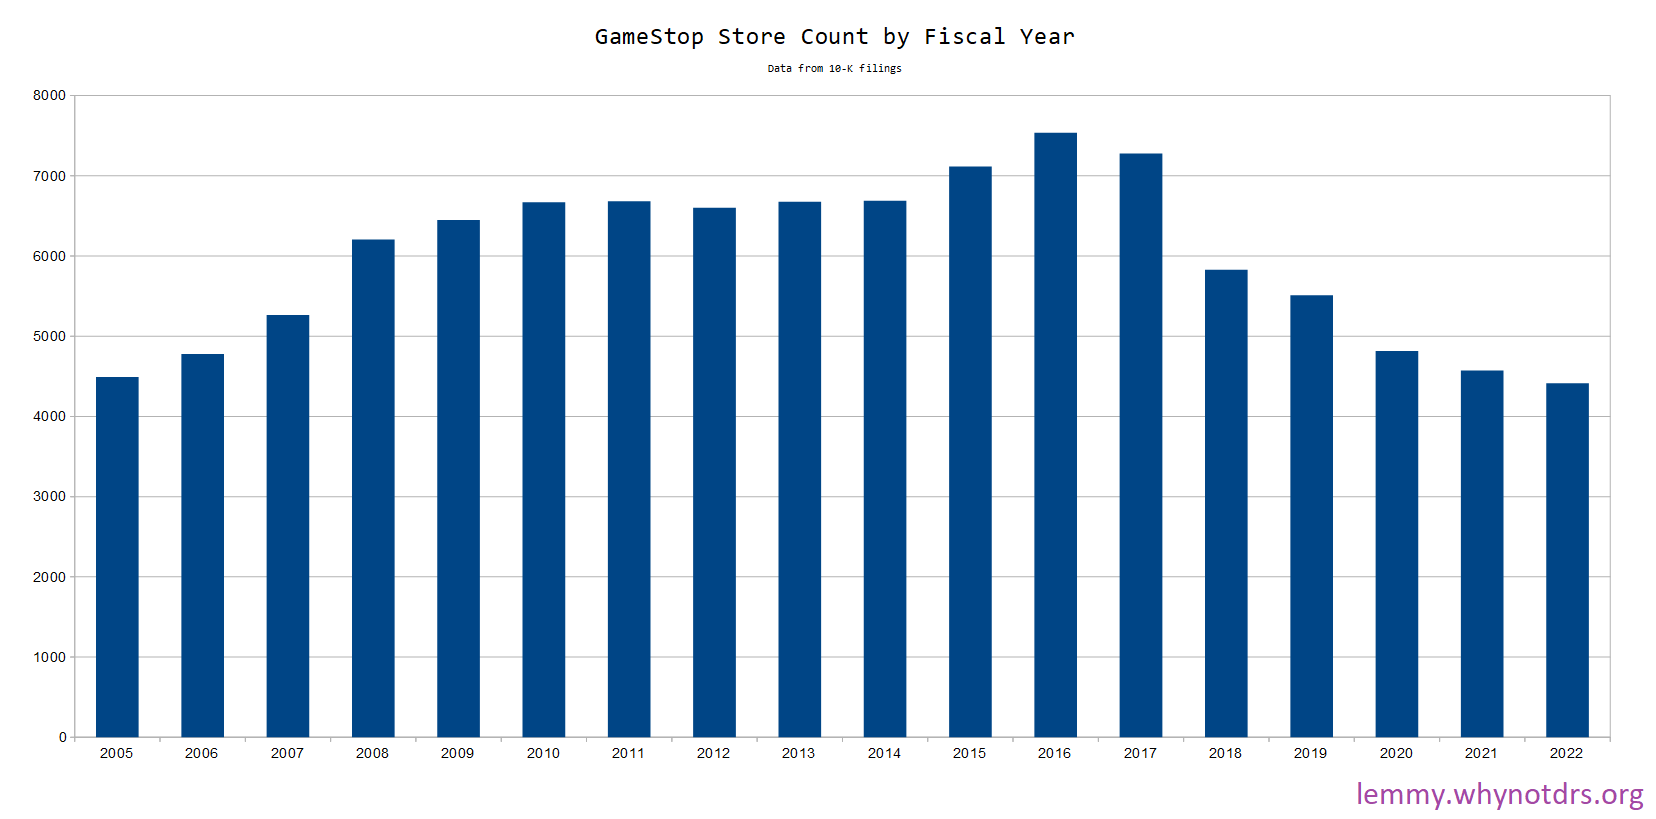
GameStop Store Count by Fiscal Year
And for fun,
GameStop Net Income Per Store
https://lemmy.whynotdrs.org/pictrs/image/a8867fa9-fa9c-4fac-98ae-79d945ded92e.png
| Fiscal Year | Revenue | Net Income | Store Count | Revenue Per Store | Net Income Per Store | 10-K |
|---|---|---|---|---|---|---|
| 2005 | $3,091,783,000 | $100,784,000 | 4490 | $688,593.10 | $22,446.33 | link |
| 2006 | $5,318,900,000 | $158,250,000 | 4778 | $1,113,206.36 | $33,120.55 | link |
| 2007 | $7,093,962,000 | $288,291,000 | 5264 | $1,347,637.16 | $54,766.53 | link |
| 2008 | $8,805,897,000 | $398,282,000 | 6207 | $1,418,704.20 | $64,166.59 | link |
| 2009 | $9,077,997,000 | $377,265,000 | 6450 | $1,407,441.40 | $58,490.70 | link |
| 2010 | $9,473,700,000 | $408,000,000 | 6670 | $1,420,344.83 | $61,169.42 | link |
| 2011 | $9,550,500,000 | $339,900,000 | 6683 | $1,429,073.77 | $50,860.39 | link |
| 2012 | $8,886,700,000 | -$269,700,000 | 6602 | $1,346,061.80 | $40,851.26 | link |
| 2013 | $9,039,500,000 | $354,200,000 | 6675 | $1,354,232.21 | $53,063.67 | link |
| 2014 | $9,296,000,000 | $393,100,000 | 6690 | $1,389,536.62 | $58,759.34 | link |
| 2015 | $9,363,800,000 | $402,800,000 | 7117 | $1,315,694.82 | $56,596.88 | link |
| 2016 | $8,607,900,000 | $353,200,000 | 7535 | $1,142,388.85 | $46,874.59 | link |
| 2017 | $9,224,600,000 | $34,700,000 | 7276 | $1,267,811.98 | $4,769.10 | link |
| 2018 | $8,285,300,000 | -$673,000,000 | 5830 | $1,421,149.23 | $115,437.39 | link |
| 2019 | $6,466,000,000 | -$470,900,000 | 5509 | $1,173,715.74 | $85,478.31 | link |
| 2020 | $5,089,800,000 | -$215,300,000 | 4816 | $1,056,852.16 | $44,705.15 | link |
| 2021 | $6,010,700,000 | -$381,300,000 | 4573 | $1,314,388.80 | $83,380.71 | link |
| 2022 | $5,927,200,000 | -$313,100,000 | 4413 | $1,343,122.59 | $70,949.47 | link |

Add comment