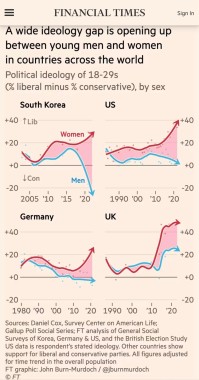
The comment is part of the data analysis so I didn't crop it (jlai.lu)
Emoji "anomalies" by European countries (jlai.lu)
The weight of different breeds of chicken over their lifespan (i.imgur.com)
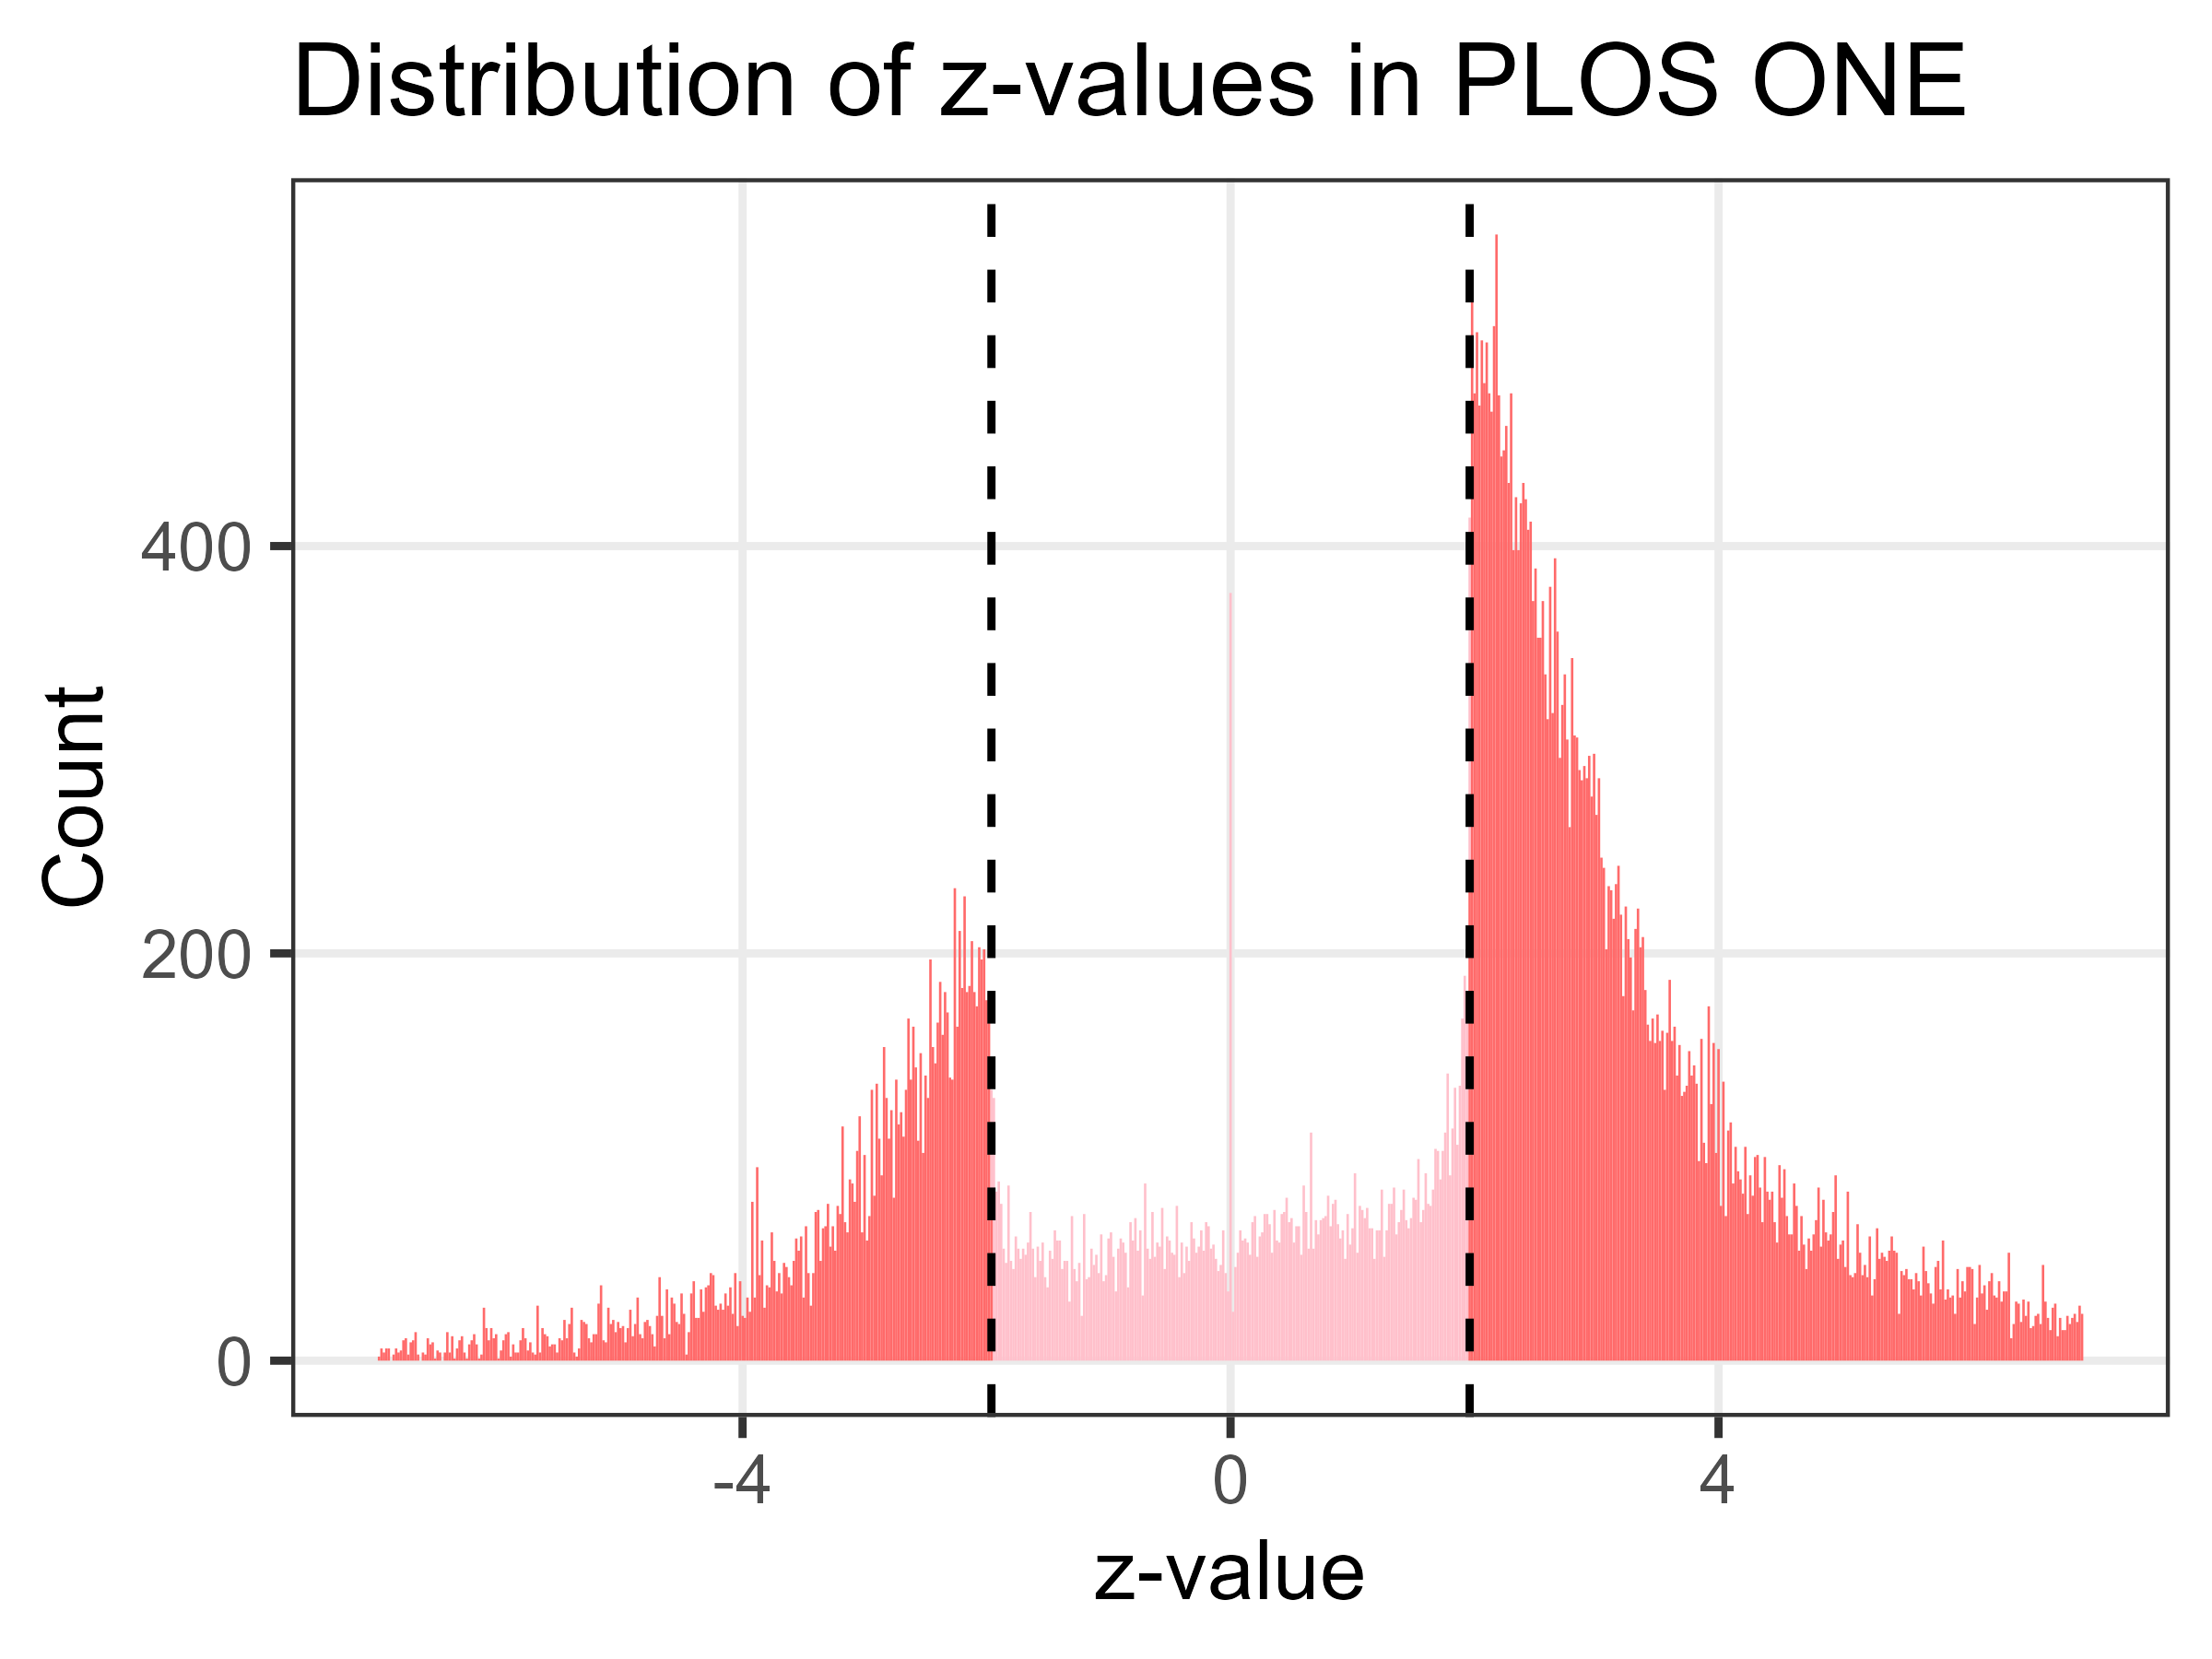
EDIT: for some context on the problems this creates...
Closest subway line from you, France (jlai.lu)
Transportation mode, World vs USA (jlai.lu)
Twenty-nine research teams analyzed the same data, and they all reached different results. (fivethirtyeight.com)
fivethirtyeight.com/…/science-isnt-broken/...
The decline of the Simpsons 📉 (jlai.lu)
Love Life Satisfaction Around the World (lemmy.ml)
Source
Euler diagram of the terminology of the British Isles (lemmy.sdf.org)
Apologies. This might not be the perfect community for the post.
New gender gap (lemmy.ml)
Where in the World Do Men Sit Down to Wee? (leminal.space)
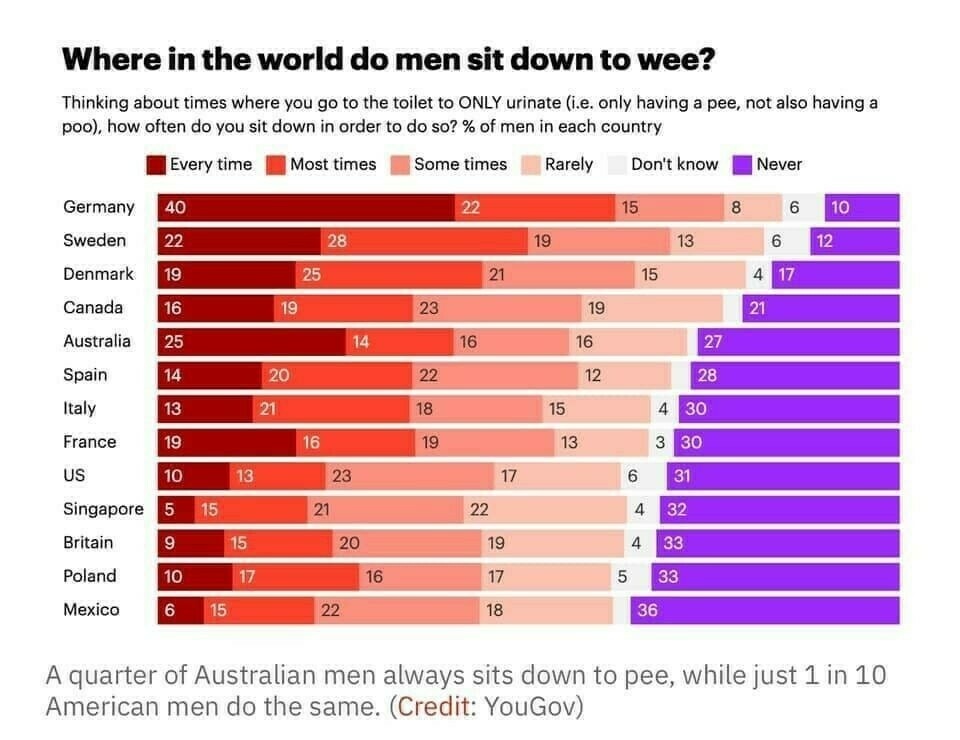
Answering the age old question…
Distribution of more than 64,000 Z-values from PLOS ONE. Despite being a journal that welcomes null results, there's a huge hole of non-significant studies. (raw.githubusercontent.com)
Created by Adrian Barnett: twitter.com/aidybarnett/…/1572006426167619585
Outcomes of Jan. 6 Riot Cases (lemmy.ml)
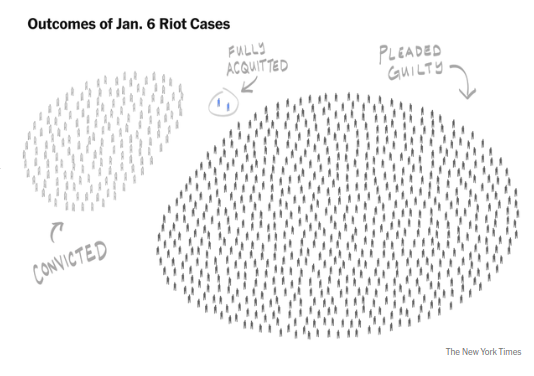
New York Times managed this with eloquence.
What people call soft drinks around the US by county (external-content.duckduckgo.com)
source...
Recently had my first covid infection and decided to put together a little diagram about how it went (i.imgur.com)
Countries scaled by foreign aid received from the US (web.archive.org)
Japanese penguins relationship charts 2024 (file.coffee)
Source:...
Terrestrial Vertebrate Biomass (lemmy.ml)
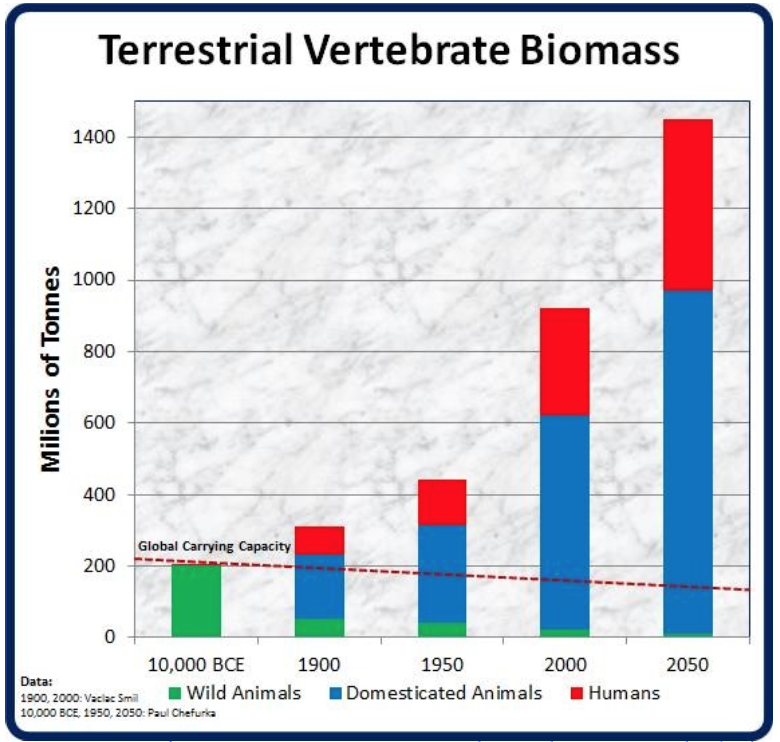
source: greenpeace.org/…/how-much-of-earths-biomass-is-af…
Because of the use of salt to de-ice highways, coastal varieties of plants (Cochlearia danica pictured here) grow along the major highways in the Netherlands. (i.imgur.com)
The temperature graphs for two public saunas that are open around the clock (sopuli.xyz)
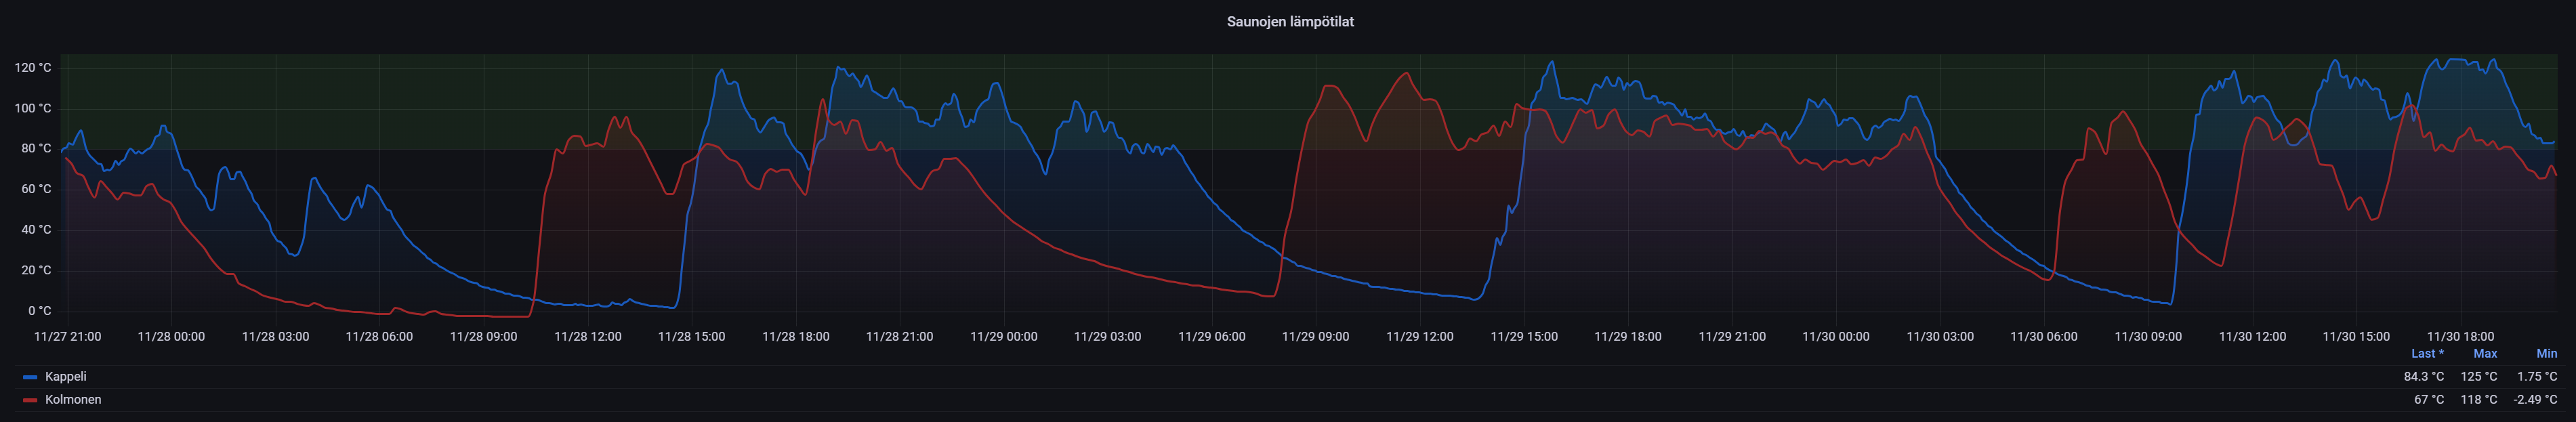
Source (in Finnish).
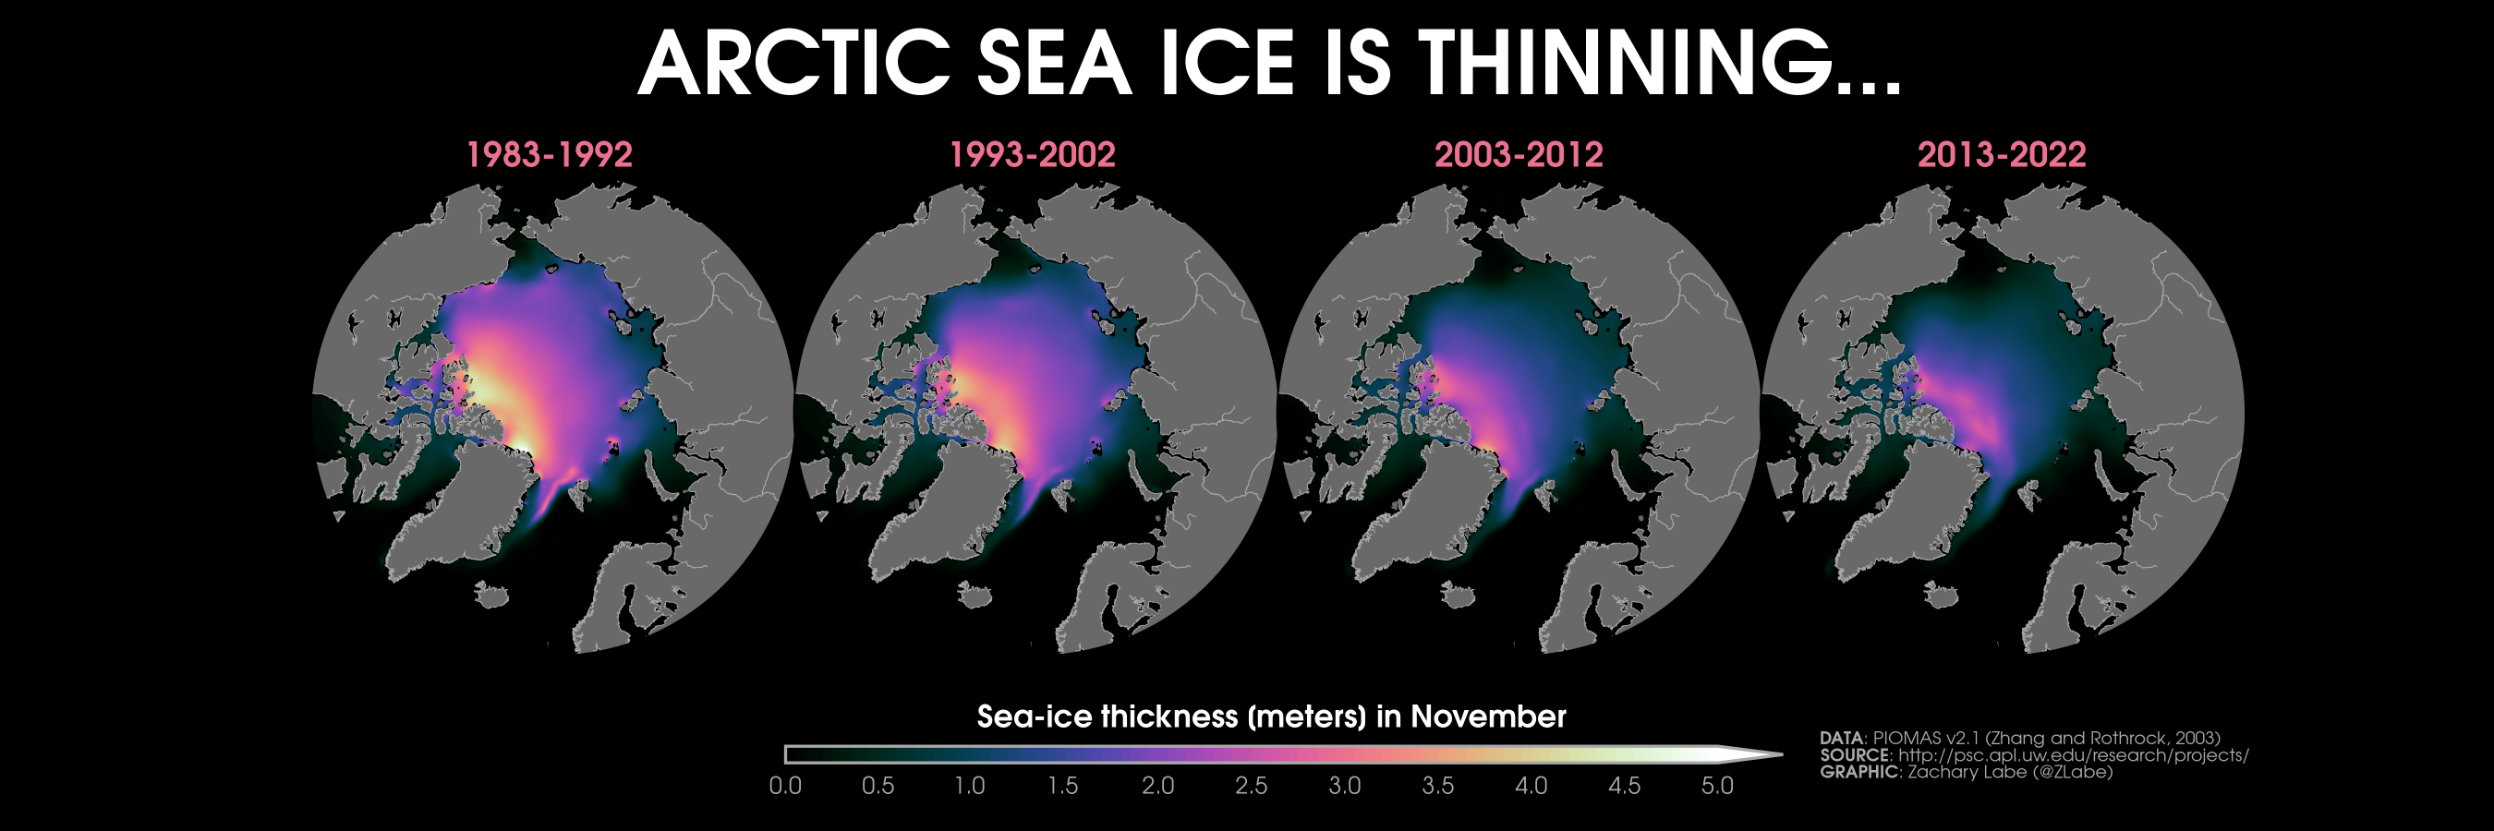
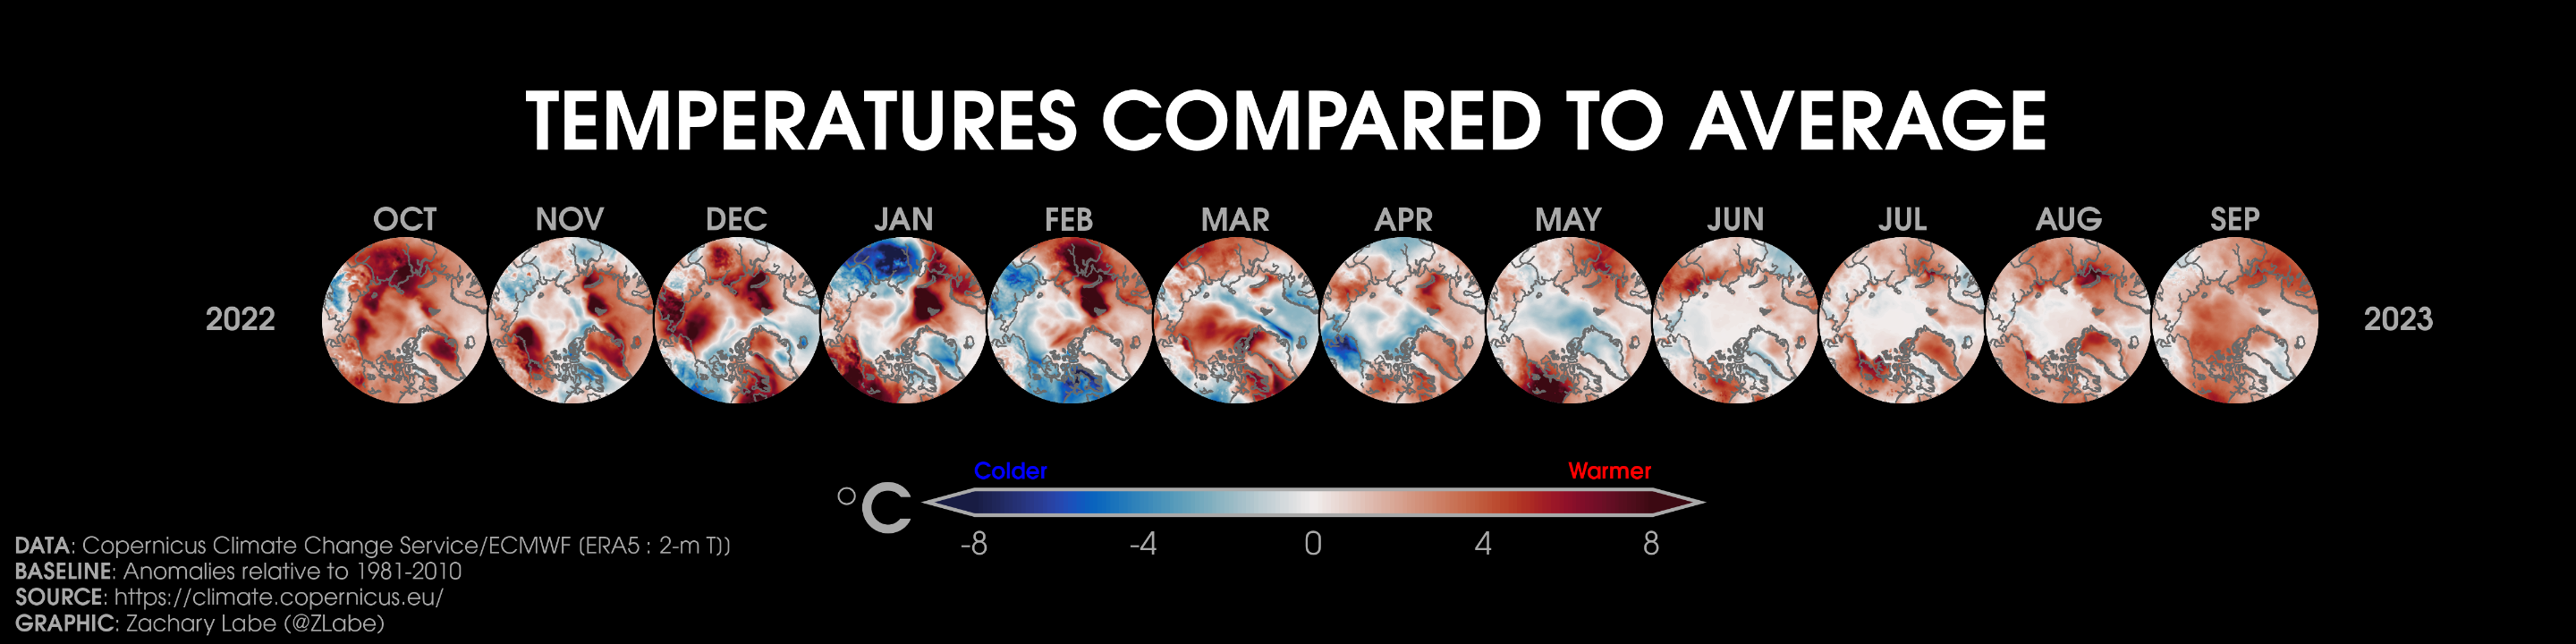
Changes in November Arctic sea ice thickness by decade (fediscience.org)
by @ZLabe (toot)...
Mapping changes in temperature: every year from 1850 to 2023 (fediscience.org)
Red indicates a higher average temperature than the previous year; blue the opposite....
Evolution of recorded-music revenue over the last 50 years (files.mastodon.social)
source...
2023 temperatures compared to average (fediscience.org)
by @ZLabe...