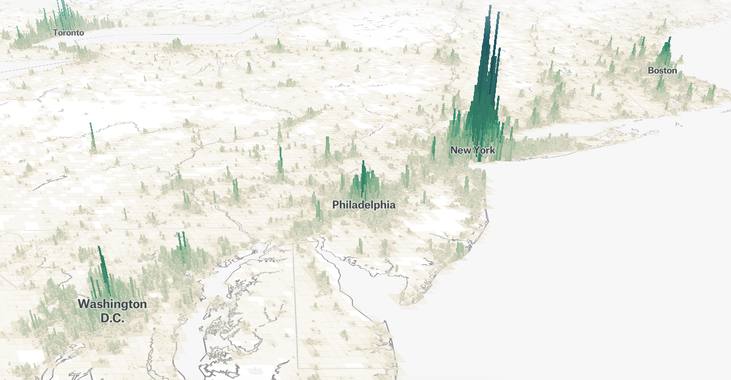
Visualisation des densités urbaines des villes du monde, données de 2015 (pudding.cool) French
Visualisation assez intéressante, dommage que les données datent un peu
Visualisation assez intéressante, dommage que les données datent un peu
For a few weeks in the Spring of 2024, readers took turns tracing the previous person’s drawing to make a flipbook-style animation. The result was 22,454 drawings.


this is an interesting visual essay which covers the change between Rolling Stones’ 2003 “500 Greatest Albums of All Time” list and its 2020 “500 Greatest Albums of All Time” list and what probably informs the turnover between those lists
