Comparing Global Population Projections to 2100 (www.visualcapitalist.com)


Source

HK is far and away the #1 least affordable housing market ranked by housing cost divided by median income....
It is certainly not perfect, but still an impressive piece of work....

https://www.visualcapitalist.com/population-of-india-compared-with-countries/

If Ryan Cohen took a salary in that leauge the bear thesis would still be alive and the turnaround of GameStop might never happen (or be significantly delayed). My executive chairman has other plans 🙌

This graphic reveals the top 20 highest paid CEOs in the S&P 500 from Sundar Pichai to Warner Bros. Discovery's David Zaslav.
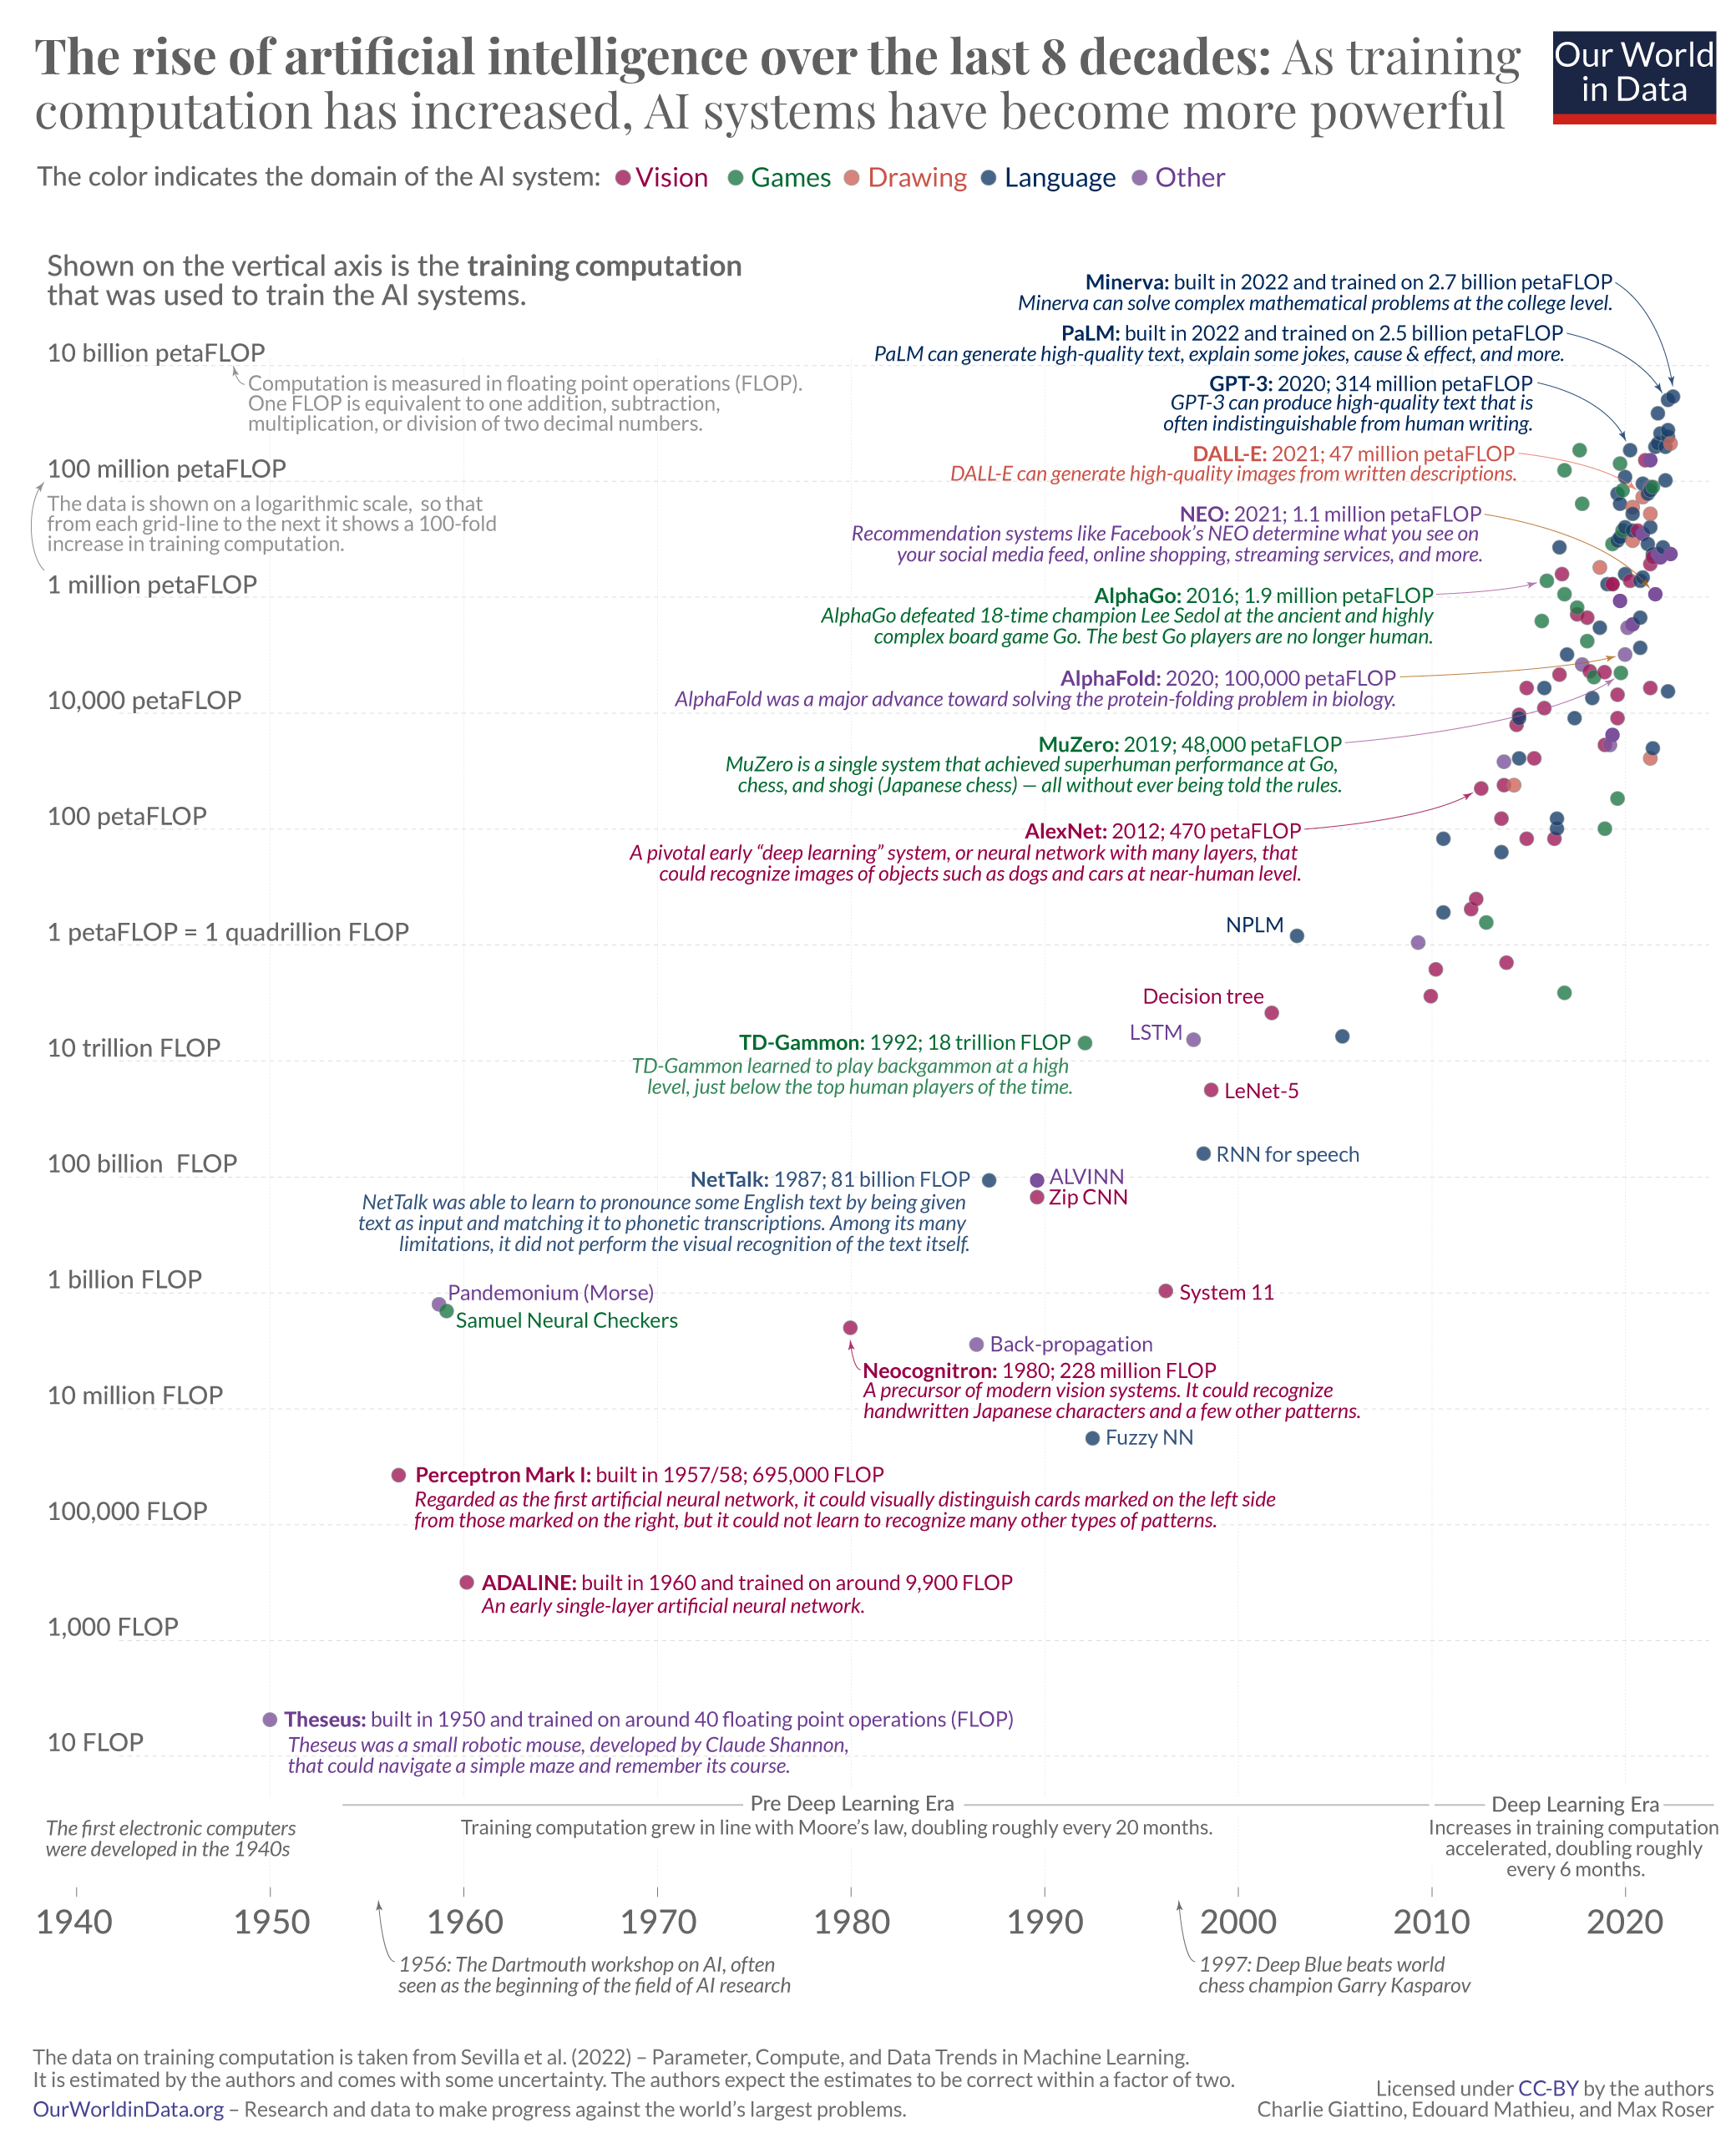
https://www.visualcapitalist.com/wp-content/uploads/2023/09/CP_AI-Training-Computation_Full-Sized.png

Some of these numbers are shocking. Who knew that Taiwan has 14 Costcos, whereas France only has 2 and New Zealand only 1?

Source: visualcapitalist.com/visualizing-the-brics-expans…

Article: visualcapitalist.com/…/video-games-industry-reven…


A great Sun comparison diagram that’s both informative and kinda retro.

Another great visualization and the effects of gravity on each planet. Fun stuff!

Nice visual breakdown of the estimated content of the universe from Visual Capital’s website.

Cool visualization of light speed using planetary scales.

Since so many seemed to like the content of the universe post, I’ll post some more. I love these big diagrams and posters. I’m in no way affiliated with the site, but love how they present topics in large, easy to understand visuals. Hope you all like them too.


Massive map of bodies in the universe. Visit Pablo Carlos Budassi’s website for official posteres, pablocarlosbudassi.com/…/the-celestial-zoo-celest…. Not affiliated with the website or Pablo Budassi.

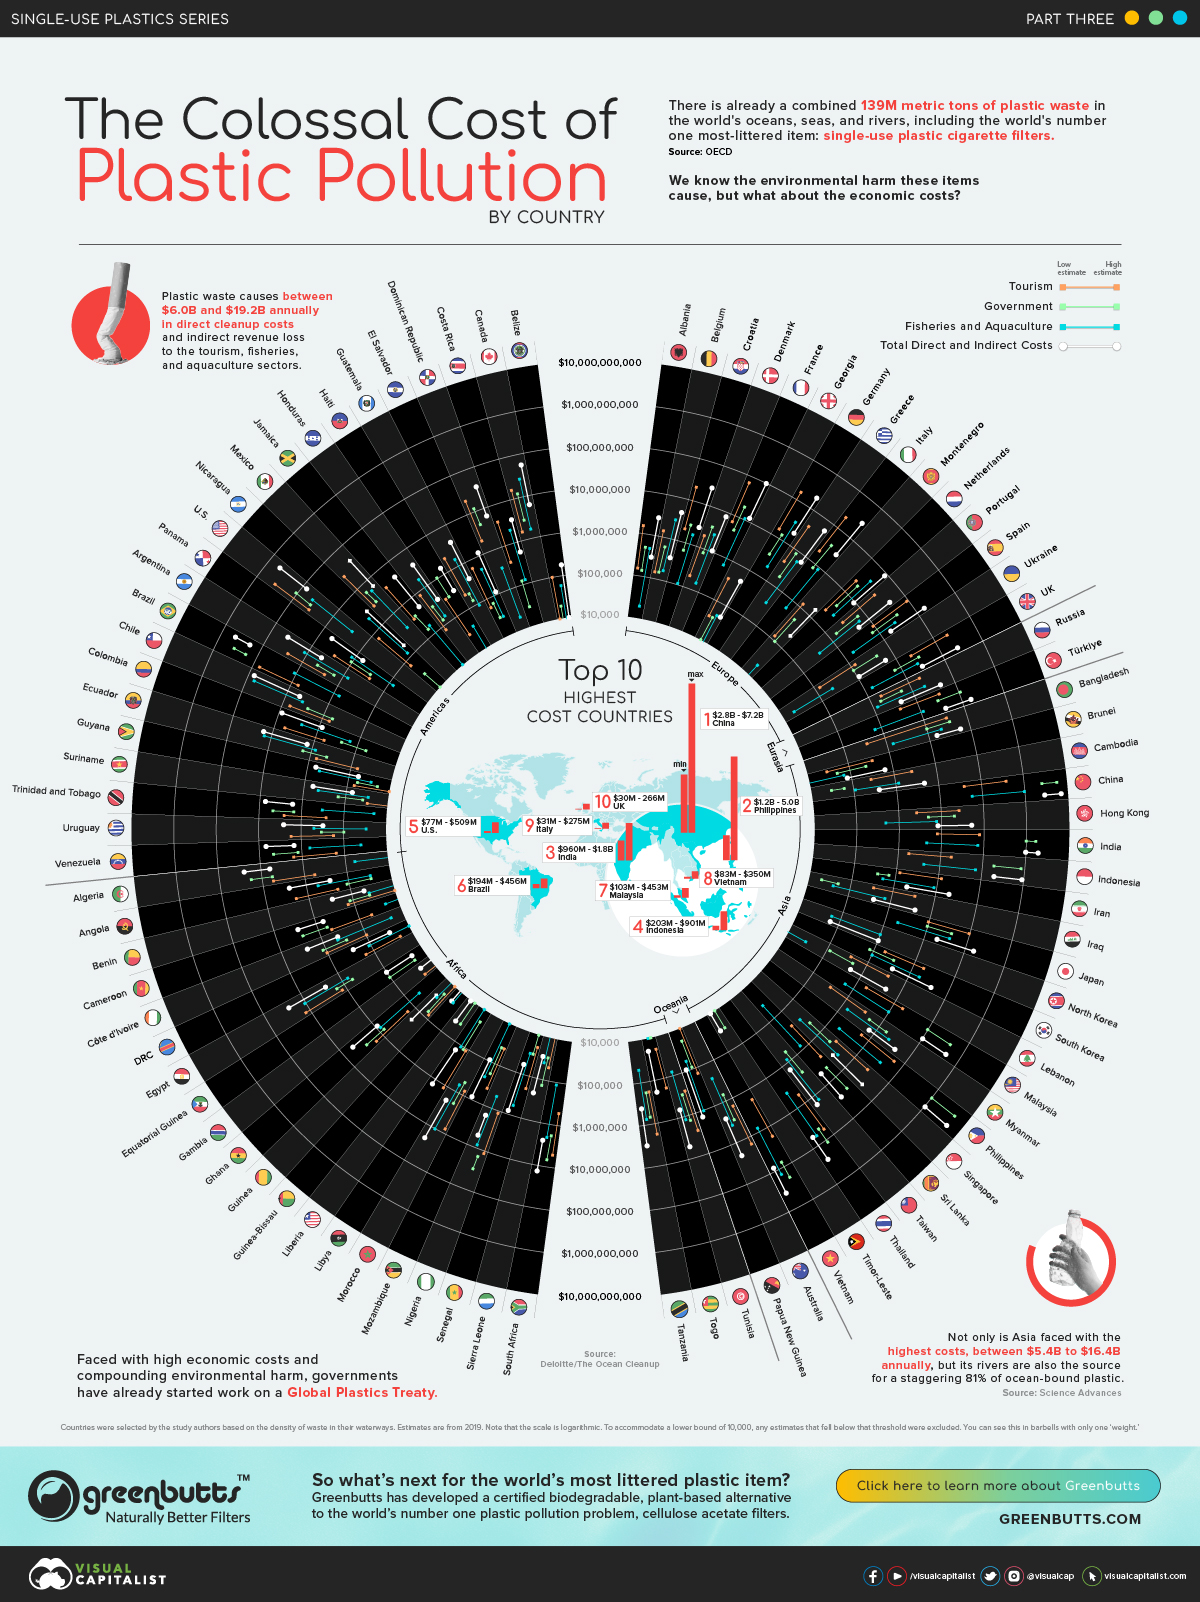
visualcapitalist.com/…/mapped-the-colossal-cost-o…

https://www.visualcapitalist.com/wp-content/uploads/2023/06/robotics-and-ai-industries-infographic.jpg