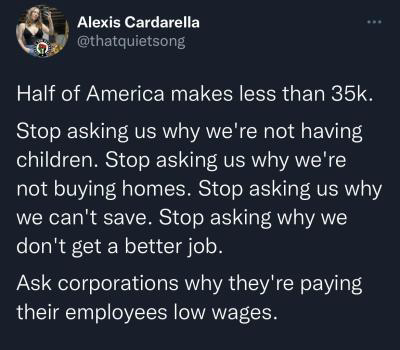
The figure referenced in this tweet is likely referring to the 2021 net compensation chart we saw making the rounds a few weeks back. Indeed, it’s correct, ~50% of all Americans made less than 35k per year in net total compensation in 2021.
In 2022, that figure rose to ~40k. So the trend is going in the right direction, at least. And IIRC, the chart does include teenagers, college students, people working part time or underemployed, etc.
35->38 is roughly what inflation would give you from 2021 to 2022. And that’s when the 40k figure came from. So, the implication is still fairly positive.
I looked around and the average salary Q4 last year was over $59k.. I don’t know what the meme used for the “half” metric, but if they used the entire population of the US that would certainly drive the average down by including people of non-working age. The average I cited probably doesn’t account for unemployment, but that’s only 3.7% so that’s not going to push the cited average much lower.
If half the working-age, non-disabled adults in this country were literally only making the meme wage or less it would be incredibly dire.
Yeah but I’d also start start asking why you’re still voting Trump and believing he can be anyhow beneficial to your cause, or is that the other half making >35k a year who evidently then must have subconsciously self-organized like a swarm to unanimously vote for him?
If you want to be pedantic about how different countries abbreviate names and include Central and South America I bet the given figure is still accurate.
Do you correct people who say “Germany” instead of “Deutschland”? No, just typical USA hatred?
"Our merchants and masters complain much of the bad effects of high wages in raising the price and lessening the sale of goods. They say nothing concerning the bad effects of high profits. They are silent with regard to the pernicious effects of their own gains. They complain only of those of other people.”
― Adam Smith, An Inquiry into the Nature and Causes of the Wealth of Nations
It appears that the claim that half of Americans make under $35,000 is not accurate. According to the U.S. Census Bureau, the median personal income in the United States for 2022 was $40,480 (FRED - fred.stlouisfed.org/series/MEPAINUSA646N). Additionally, data from DQYDJ shows that at the 40th percentile, income was approximately $58,001, suggesting that less than half of the population earns under $35,000 (DQYDJ – Don’t Quit Your Day Job - dqydj.com/average-median-top-household-income-per…).
Furthermore, the median household income was reported to be $74,580 in 2022, a figure that significantly exceeds the $35,000 threshold (Census.gov - www.census.gov/library/…/p60-279.html). This indicates that the median individual and household incomes in the U.S. are both higher than $35,000, disproving the initial claim.
Median weekly earnings of full time workers is over $1100/week now, so the median full time worker is probably making well over $50k/year, if they can hold down a job for the full year and work full time hours.
Lots of people don’t work because they don’t want to work, and don’t need to work: retirees, students, married to rich spouses, etc. Including them in the denominator can be helpful for measuring some things, but would be misleading to assume that the median individual income across all individuals would mean what most commenters in this thread seem to think it means.
If you look at what they count as full-time jobs, And then you compare that to how many people are actually willing to offer full-time jobs rather than just a job that takes all of your time you might better understand this.
The numbers are manipulated by what they choose to exclude. And $50,000 in today’s dollars is less than an elevator operator made during the Great depression.
For you and !go_go_gadget, isn’t the Census bureau a national survey with self reporting that only covers like 1% of the population? Both “Fred” and dqydj.com use the Census bureau to calculate their viewpoints from what I understand? If I’m reading the government site wrong or looking at the wrong surveys please correct me. I understand the “Census” to be more of a judge or indicator of patterns but not to be used as concrete data in which to come to solid conclusions from.
I had ran into the census pdf as well before seeing this link, the beginning has an interesting passage which none of the authors seem to mention in the articles,
Real median household income was $74,580 in 2022, 2.3 percent lower than the 2021 estimate of $76,330. It was 4.7 percent lower than the 2019 median, the year before the start of the COVID-19 pandemic and the corresponding recession (Figure 1 and Table A-1).6 The estimate of median household income in 2019 was the highest since 1967 source
Also an important caveat,
The income estimates in the main sections of this report are based on the concept of money income, which is pretax and does not account for the value of in-kind transfers. Estimates of post-tax income and inequality are included in Appendix B. Real median post-tax household income exhibited a substantial decline in 2022 from 2021. This was due in part to the expiration of policies introduced in response to the COVID-19 pandemic, such as Economic Impact Payments and the expanded Child Tax Credit.
I’ve been reading over a few of the articles from www.dqydj.com and it feels very sketchy. I can pinpoint a few questionable passages that seem to pass on an intent, but in general how they dissect the data always has a “but we left out this part” footnote. It’s especially hilarious with the article you linked,
What was the median household income? In 2023, $74,202 was the median household income in the United States. This is up from $70,181 in 2022 (unadjusted for inflation – see below).
They then proceed below to show a graph that completely contradicts their statement.
Only 46% of the population are working. minneapolisfed.org/…/whos-not-working-in-the-us-l…So technically, technically the quote is correct. The stat you are quoting is the median salary of someone working full-time is $58,001. So it leaves out all those people un and underemployed or who just gave up on joining the workforce. Idk where you got the 40,480 because your link just goes to a broken link. Millennials are also making less money are less likely to be married and have higher unemployment numbers than gen x so our numbers would be more screwed than the overall median which is what the original tweet was referencing when saying stop asking us about buying houses or having kids.
The media isn’t asking these questions because they don’t know the answers, they’re asking because people are a lot more likely to think there isn’t a clear answer when they see people asking the question over and over. If there’s a clear answer, then people who want to believe that the younger generation is just lazy will have to come to terms with the fact that they’re wrong, or worse yet, leave for another news channel that lets them keep denying it! No, they’re going to keep on asking questions and letting the viewer answer them on their own, filling in the blanks to validate whatever biases they have.
There’s a chapter in the book where he talks about the economics of being a biker/drop out/artist circa 1970.
A biker could work six months as a union stevedore and earn enough to stay on the road for two years. A part time waitress could make enough to support herself and her musician boyfriend.
Or, to put it another way, in 1960 minimum wage was $1.00/hour and the cost of the average home was $11,000.00. A burger flipper could get hired on high school graduation day and be a home owner in 20 years without ever getting a raise.
You can still be a nomad at today’s wages. I have a friend who works for a school year as a teacher, and then travels extensively for a couple of years. He lives like a nomad though, no fancy hotels or accommodations. That’s what the Hell’s Angels did back then too, in addition to plenty of additional illegal activities which provided them extra funding.
Well, one other thing in the 70s was everyone kind of lived a simpler life anyway. Not many had really luxurious things, and most places weren’t trying to be anything fancy. It’s just a place to live and the basics for most. I love what we have today, but I also miss those times as well since nobody cared if your place of living wasn’t up to date with all the luxeries we come to take for granted as necessities or judged for possibly not having them.
You can't live that life even if you tried, and it's percisily the basica that are unaffordable these days. The luxury stuff is cheap but housing education childcare food and transportation ruin people
Reminder that median means "half of the samples are above this point and half of the samples are below, which means exactly what was stated in the OP “half of America”
I fully support the ideas from OP that corporations need to pay people better and wages need to at least attempt to track economic gains, but we can send that message while telling the truth and citing our sources to prove that the message is legit.
The median net compensation for American workers in 2019 was $34,248.45, which is less than $35,000. So, the claim in the screenshot is apparently accurate for individuals. Granted, household income is a better indication of socioeconomic standing for people with spouses.
That’s “Household income”. Household income is the most useless and skewed statistic I can think of when it comes to equality and actual income per person.
In my mind rich people can afford to live in different homes. Poor people can not afford to do so. That means if 8 poor people who each make eg 10k a year share a household then their household earns 80k. Now if 8 less-poor people who each make eg 40k a year are split over four households then their households also make 80k each.
So now there’s 4 households of 2 people each that make as much as 1 household of 8 people. Here statistically 100% of households make exactly 40k. Regardless 50% of those 16 people still make less than 35k a year.
In reality people inside one household have different incomes, which means even among the 4 slightly richer households in the example above some inhabitants would probably make less than 35k.
One question I have is how do household-statistics count people who have multiple houses? If a rich person owns 10 houses, then does it count as 10 households who earn >35k? I hope not.


Add comment