@mappingsupport@m.ai6yr.org
@mappingsupport@m.ai6yr.org avatar

mappingsupport

@mappingsupport@m.ai6yr.org

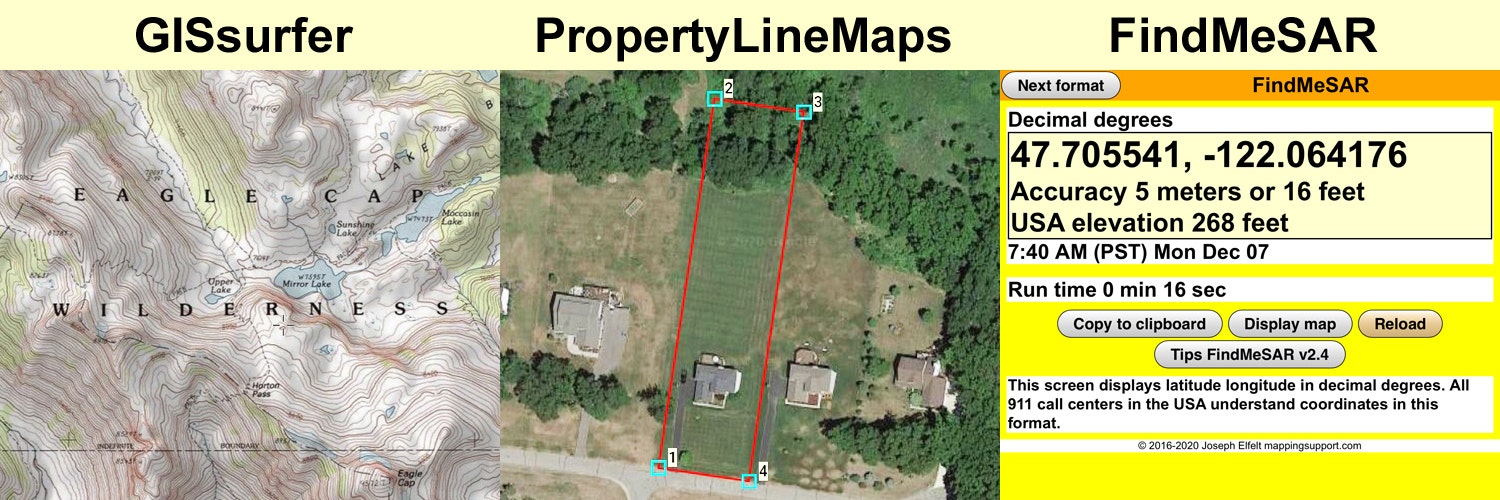
Developer of #GISsurfer web map using the #Leaflet map API.

Developer of #GeoJPG web app. Offline maps with NO ads, NO tracking, NO signup and NO fees. #PWA

Developer of #FindMeSAR web app. #PWA

Curator of 3,000+ #ArcGIS server list.

Consultant producing property line maps to help you find lost survey stakes.

Lives in #PNW.

This profile is from a federated server and may be incomplete. Browse more on the original instance.

GottaLaff, (edited ) to legal
@GottaLaff@mastodon.social avatar

Totally forgot!! in all caps!

‼️! 🔥 1/…

Via Anna Bower:

BREAKING: DC Circuit Court of Appeals rules that Donald is NOT IMMUNE from prosecution.

UNANIMOUS!!!

mappingsupport,
@mappingsupport@m.ai6yr.org avatar

@GottaLaff Made my day!!!!!!!!!!

mappingsupport, to random
@mappingsupport@m.ai6yr.org avatar

Got radar?

I have a shortcut on my PC’s screen that starts GISsurfer and displays a red marker at my home and the weather radar. This is very useful for staying on top of our local weather.

The map link below displays a similar map with 2 markers at random spots. To change this map to have a marker at you home:

  1. Open the map
  2. Click Menu > Link to this map
  3. Edit the coordinates at the end of the link.

Copy the edited link and paste it into a browser.

Open GISsurfer map:
https://mappingsupport.com/p2/gissurfer.php?center=34.112946,-118.534241&zoom=9&basemap=USA_basemap&overlay=USA_weather_radar,State_boundary,County_boundary,County_name,USA_roads&data=https://mappingsupport.com/p2/special_maps/disaster/USA_weather.txt||34.210656,-118.630371||34.101528,-118.402405

mappingsupport, to maps
@mappingsupport@m.ai6yr.org avatar

Trouble sleeping?
Try writing software documentation. 😴 😴 😴 😴😴 😴 😴 😴
Time for a 🛌

GeoJPG v2 launch on target for March 19 - maybe sooner.

Make your own custom maps, host them for free on Google Drive, view them offline and see your geolocation.

No ads. No tracking. No signup. No cost.

I am developing this as a public service and part of my way to "pay it forward". Plus I am having a blast doing this since - to the best of my knowledge - this is a new approach to offline maps.

ai6yr, to random

continues. Camera or power adapter shorted out. About 1 inch, but not up to the sandbags.

mappingsupport,
@mappingsupport@m.ai6yr.org avatar

@ai6yr No doubt you are real tired of water misery by now.

mappingsupport, to random
@mappingsupport@m.ai6yr.org avatar

Dam!

All the area outline in pink/black drains down to the Whittier Narrows Dam in Los Angeles County. Some of the heaviest rains of the current storm are expected to fall in the higher elevations of this drainage basin.

Red markers are a concrete spillway on the San Gabriel River and another one on Rio Hondo. Between them is a long earth dam in serious need of repair. The Army Corp plans to start work on those repairs next year.

News article:
https://www.kcrw.com/news/shows/greater-la/flood-risk-oc-tiktok/whittier-narrows-damhttps://www.kcrw.com/news/shows/greater-la/flood-risk-oc-tiktok/whittier-narrows-dam

Army Corp says:
https://www.spl.usace.army.mil/Missions/Civil-Works/Dam-Safety-Program/Whittier-Narrows-Dam-Safety-Modification-Project/

Open GISsurfer map: https://bit.ly/42t2oEv

image/jpeg
image/jpeg
image/jpeg

mappingsupport, to venturacounty
@mappingsupport@m.ai6yr.org avatar

Head's up for and . There is now a "high" (at least 70%) chance of excessive rain on day 2. This is the pink area on the map.

Further south there is a 40-69% chance of excessive rain on day 3. This includes the entire LA area.

Map shows problem dams - clickable.

On Sunday wind gusts at Point Conception are forecast to be about 70mph from 7am to noon. To see a similar hour-by-hour forecast for any spot, rightclick the map and a sidebar will open. Near the top of the sidebar click 'Hourly forecast'.

Mobile users can do a simulated rightclick by taping the angle symbol at the left edge of the screen. Drag the crosshair then tap and the sidebar will open.

image/jpeg
image/jpeg

mappingsupport,
@mappingsupport@m.ai6yr.org avatar
mappingsupport,
@mappingsupport@m.ai6yr.org avatar

@ai6yr 👍 Clicking a dam will display the attribute data including 'Name' and 'Condition Assessment'.

mappingsupport, to pnw
@mappingsupport@m.ai6yr.org avatar

Got Iris?

Some of the earliest flowers to bloom at our place near Redmond WA is a patch of dwarf Iris. These things only get about 8" high. Pity that I have not been keeping track over the years of when they start blooming. Sure seems like an extra this year in the .

mappingsupport, to random
@mappingsupport@m.ai6yr.org avatar

Interactive map shows GOES West satellite view and (clickable) weather watches/warnings.

For the details from NOAA, including timing, open the map, zoom in, click any colored area and scroll down through the popup. Each type of watch/warning for the spot you clicked has its own link for the details.

To search on your address click Menu > Search.

Map has many weather layers you can turn on/off. A number of layers have attribute data that includes link leading to more info.

To get the most benefit from the map please read the “Map tips” link in upper left corner.

Open map:
https://mappingsupport.com/p2/gissurfer.php?center=31.614944,-127.353516&zoom=4&basemap=GOES_West_color&overlay=State_boundary,Weather_watch_warning&data=https://mappingsupport.com/p2/special_maps/disaster/USA_weather.txt

image/jpeg
image/jpeg

mappingsupport, to random
@mappingsupport@m.ai6yr.org avatar

Friday a.m.
NOAA has posted its morning ‘forecast discussion’. Here is a snip for the Los Angeles/Oxnard forecast area:

...SIGNIFICANT THREAT OF WIDESPREAD AND VERY DANGEROUS FLASH
FLOODING SUNDAY INTO MONDAY, ESPECIALLY FROM SOUTHERN SANTA
BARBARA SOUTHWARD...

To read the full forecast discussion, open the map, click inside any red-outlined area and follow the link in the popup.

Open GISsurfer map:
https://mappingsupport.com/p2/gissurfer.php?center=34.316534,-118.718262&zoom=6&basemap=USA_basemap&overlay=State_boundary,Forecast_discussion&data=https://mappingsupport.com/p2/special_maps/disaster/USA_weather.txt

mappingsupport, to venturacounty
@mappingsupport@m.ai6yr.org avatar

Thursday evening.
When this map opens there are 2 layers from NOAA’s GIS server displayed:
Excessive rain forecast day 4
and
Excessive rain forecast day 5

For red and orange areas there is a 40-69% chance NOAA will issue a flash flood warning.

In red areas this applies for both day 4 and day 5.
In orange areas this applies to day 5.

The map always shows days in the future. So on Friday you want to turn on the layers for day 3 and day 4. For help working with layers please read the "Map tips" link in the upper left corner of the map.

Open GISsurfer map:
https://mappingsupport.com/p2/gissurfer.php?center=34.209669,-119.080810&zoom=8&basemap=USA_basemap&overlay=State_boundary,Excessive_rainfall_forecast_day_4,Excessive_rainfall_forecast_day_5,USA_roads,County_boundary,County_name&data=https://mappingsupport.com/p2/special_maps/disaster/USA_weather.txt

mappingsupport, to random
@mappingsupport@m.ai6yr.org avatar

The GISsurfer maps that I post often display multiple layers of data. Only the ‘top’ layer is clickable to see the attribute data for the thing that you clicked.

The top layer on this map shows dams that (1) are regulated by the state and (2) in ‘poor’ or ‘unsatisfactory’ condition.

NOTE! There are other problem dams regulated by the feds that are not on this map!

The colored shading is a running forecast for amount of rain expected over next 7 days.

If you need help turning on other GIS layers, please read the 'Map tips' link in upper left corner of the map.

Open GISsurfer map:
https://mappingsupport.com/p2/gissurfer.php?center=33.849707,-118.026123&zoom=8&basemap=USA_basemap&overlay=State_boundary,Rain_forecast_day_1-7,Lake_river_stream,USA_roads,County_boundary,County_name,California_problem_dams&data=https://mappingsupport.com/p2/special_maps/disaster/USA_weather.txt

mappingsupport, to random
@mappingsupport@m.ai6yr.org avatar

NOAA says “largest storm of the season will begin late Saturday night”.

Interactive GIS map has 20+ weather related layers. For help using the map please read the ‘Map tips” link in upper left corner.

To read NOAA’s forecast discussion, click in any red-outlined area and follow the link.

Screenshot text is for the LA area and halfway up the coast toward the Bay area.

Open GISsurfer map:
https://mappingsupport.com/p2/gissurfer.php?center=34.677787,-119.553223&zoom=6&basemap=USA_basemap&overlay=State_boundary,Forecast_discussion&data=https://mappingsupport.com/p2/special_maps/disaster/USA_weather.txt

image/jpeg

mappingsupport, to random
@mappingsupport@m.ai6yr.org avatar

Lots of weather watches and warnings for the incoming storm. For the details from NOAA, including timing, open the map, click, scroll down through the popup. Each type of watch/warning for the spot you clicked has its own link for the details.

Open map:
https://mappingsupport.com/p2/gissurfer.php?center=40.120312,-123.046875&zoom=6&basemap=USA_basemap&overlay=State_boundary,Weather_watch_warning&data=https://mappingsupport.com/p2/special_maps/disaster/USA_weather.txt

mappingsupport, to random
@mappingsupport@m.ai6yr.org avatar

One of my ‘go to’ sources for detailed weather info is the ‘forecast discussion’ produced daily for each forecast area. To read any discussion, open the map, click any red-outlined area, follow the link.

The text screenshot is from the discussion for the northern California coast area. Note the possibility of significant small stream flooding.

Open GISsurfer map:
https://mappingsupport.com/p2/gissurfer.php?center=39.597081,-121.069336&zoom=6&basemap=USA_basemap&overlay=State_boundary,Forecast_discussion&data=https://mappingsupport.com/p2/special_maps/disaster/USA_weather.txt

image/jpeg

mappingsupport, to pnw
@mappingsupport@m.ai6yr.org avatar

Springtime yard cleanup is going to start early this year in the . Should be mostly dry today and partly sunny in the Redmond area.

mappingsupport, to maps
@mappingsupport@m.ai6yr.org avatar

Like ?

v2 target release date is March 19, my birthday.

This is a ‘web app’ that displays your own custom maps offline. Works on iOS and Android. Features include geolocation. No tracking. No ads. No signup. No cost.

Use GISsurfer screenshot mode to make your own custom maps. Currently maps have to be online so GeoJPG can install them for offline use. Use Google Drive (free) to put your maps online.

Sound interesting? Here is a PDF with some more info.
https://geojpg.com/website/GeoJPG_web_app_news_1.pdf

Screenshots are GISsurfer displaying some georeferenced JPG maps I made using screenshot mode.

image/jpeg

mappingsupport,
@mappingsupport@m.ai6yr.org avatar

@ai6yr I have already made a set of georeferenced JPG maps that use the scanned USGS topos and cover all of Ventura County. Before I released GeoJPG v2 I will put those JPGs on Google Drive for anyone to use.

I will also make a similar set of JPG maps that use the Open Topo Map (OSM trail data) and put those JPGs on Google Drive.

Consider these JPG maps a 'thank you' for the work you doing to provide a Mastodon instance that others can join.

mappingsupport, to random
@mappingsupport@m.ai6yr.org avatar

The Colorado State Supreme Court ruled that Trump is not eligible to be on the ballot. Trump appealed to the U.S. Supreme Court and that court will hear oral argument February 8.

The parties that filed the lawsuit seeking to have Trump declared ineligible have now filed their brief with the U.S. Supreme Court.

Open brief (pdf):
https://www.supremecourt.gov/DocketPDF/23/23-719/298854/20240126115645084_23-719%20Anderson%20Respondents%20Merits%20Brief.pdf

I just read it and while I am not an attorney this sure seems like strong and well-presented work. Hard to see how the U.S. Supreme Court can wiggle out of this and let Trump be on the ballot.

image/jpeg
image/jpeg

mappingsupport, to pnw
@mappingsupport@m.ai6yr.org avatar

Going to be a wet one.

Interactive map always shows water equivalent precipitation expected over next 7 days.

Red lines on the map are county boundaries.

The text screenshot is part of NOAA’s forecast discussion for western WA.

If you have not read the “Map tips” link in upper left corner then you are missing out on lots of other map features.

Open GISsurfer map:
https://mappingsupport.com/p2/gissurfer.php?center=46.790908,-122.937012&zoom=6&basemap=USA_basemap&overlay=Rain_forecast_day_1-7,Country,County_boundary,State_boundary,Lake_river_stream,USA_roads&data=https://mappingsupport.com/p2/special_maps/disaster/USA_weather.txt

image/jpeg

mappingsupport, to random
@mappingsupport@m.ai6yr.org avatar

Got flood? Dam!

Interactive map shows dams regulated by the State of California with a condition of “poor” or “unsatisfactory”. Open the map, zoom in and more labels will appear.

There is another set of dams in California regulated by the federal government and some of those are also in bad condition. Screenshot below shows flooded area if the federal Whittier Narrows dam fails. Regarding these federal dams in poor condition, here is an informative article by Jeff Masters:
https://yaleclimateconnections.org/2023/01/if-a-megaflood-strikes-california-these-dams-might-be-at-risk/

The feds have a GIS layer with data on each dam but that layer intentionally leaves out the 'condition' data for each dam.

Open GISsurfer map:
https://mappingsupport.com/p2/gissurfer.php?center=36.923435,-118.981934&zoom=6&basemap=USA_basemap&overlay=California_problem_dams&data=https://mappingsupport.com/p2/special_maps/disaster/USA_weather.txt

image/jpeg

mappingsupport, to random
@mappingsupport@m.ai6yr.org avatar

Got bleach?

So I made bread today and used 3 kinds of flour.
Whole wheat flour
White whole wheat flour
Unbleached white flour

The dinner conversation revolved around "unbleached white flour" and what the heck is that? I mean, can you buy bleached flour? Turns out, the answer to that is, yup.

An inquiring mind will then ponder - What chemicals are used to bleach flour? The answer to which includes the following not-so-yummy sounding ingredients.

nitrogen peroxide, chlorine gas (thought that was poisonous), chlorine dioxide, nitrogen trichloride and benzoyl peroxide
cite: https://sciencemeetsfood.org/bleached-flour/

ai6yr, to cycling

Future cargo trailer hauling MTB... if I can get it back up to speed. But now it has shiny stickers (but no tires... yet... since the online retailer I purchased the new tires from apparently sends their packages by mule train).

Same mountain bike, still with rotted tires, but now has blindly yellow white and black reflective stickers

mappingsupport,
@mappingsupport@m.ai6yr.org avatar

@ai6yr Actually they send them by cargo bike. Sorta like an updated pony express. 🚲

mappingsupport, to hiking
@mappingsupport@m.ai6yr.org avatar

Do you use AllTrails, GAIA GPS or onXmaps?
Surprise! Bet you did not know you are indemnifying those companies.

Worst case translation: The company is sued and you must reimburse the company for the attorney fees they spend defending themselves. That is my understanding of the gist of “indemnification”.

Disclaimer: I am not an attorney.

Links to TOS agreements. Search for ‘indemn’.


https://www.alltrails.com/terms
See screenshot below. I added the yellow hi-lite.

, and more
https://www.outsideinc.com/terms-of-use/


https://www.onxmaps.com/tou

  • All
  • Subscribed
  • Moderated
  • Favorites
  • megavids
  • rosin
  • InstantRegret
  • ethstaker
  • DreamBathrooms
  • mdbf
  • magazineikmin
  • thenastyranch
  • Youngstown
  • everett
  • slotface
  • osvaldo12
  • khanakhh
  • kavyap
  • anitta
  • Durango
  • vwfavf
  • GTA5RPClips
  • cubers
  • tacticalgear
  • tester
  • cisconetworking
  • ngwrru68w68
  • Leos
  • normalnudes
  • provamag3
  • modclub
  • JUstTest
  • All magazines